Software Project Estimation: A Practical Guide for PMs
Software Project Estimation: A Practical Guide for PMs Combine relative sizing (planning poker or T-shirt sizing) for early planning with a calibrated bottom-up task estimate for committed scope.
Combine relative sizing (planning poker or T-shirt sizing) for early planning with a calibrated bottom-up task estimate for committed scope. That pairing gives you the best tradeoff between speed and defensibility at every stage of the project lifecycle. Before you present to stakeholders, produce these five outputs: a 50/90 effort range, a person-month total, your assumed blended hourly rate, a contingency percentage, and a written assumptions log.
When to use which approach:
- Relative sizing now: concept stage, pre-proposal, backlog grooming, or any time requirements are still shifting
- Bottom-up estimate: committed scope with defined acceptance criteria, fixed-price bids, or regulatory/government procurement
- Both in parallel: large programs, legacy modernization, or any engagement where a single method’s error band is too wide to defend
Key Takeaways
Reliable software project estimation requires pairing relative sizing for early planning with a calibrated bottom-up check for committed scope, always reported as a 50/90 range with explicit assumptions.
| Point | Details |
|---|---|
| Match method to lifecycle stage | Use relative sizing (T-shirt, story points) early; switch to bottom-up WBS for committed scope and fixed-price bids. |
| Always report a range | Present a 50th percentile for planning and a 90th percentile for funding; single-point estimates create false precision. |
| Assumptions log is non-negotiable | Document scope boundaries, team composition, and volatility before sizing anything; this log is your audit trail. |
| Calibrate before you commit | Velocity, cost per point, and historical analogues are the inputs that separate a defensible estimate from a guess. |
| Ridiculous Engineering | Ridiculous Engineering’s scoping engagements produce a shared assumption log and a 50/90 range before any fixed-price work is agreed. |
Table of Contents
- Why accurate software estimates matter for business decisions
- When should you run estimates across the project lifecycle?
- What are the most common software estimation methods?
- How to estimate software development time
- How do you run a step-by-step estimation process?
- How do you model uncertainty in a software estimate?
- What estimation mistakes and biases should you watch for?
- Which tools and metrics help you estimate more reliably?
- When should you estimate in-house vs. bring in a consultancy?
- Worked example: estimating a three-epic release end-to-end
- Ridiculous Engineering helps you build estimates you can defend
- Sources
- FAQ
Why accurate software estimates matter for business decisions
An estimate is not a guess you dress up in a spreadsheet. It is the primary input for three decisions that determine whether a project succeeds: scope prioritization, budget approval, and resourcing plans. Get it wrong in either direction and the consequences are concrete: underfunded projects get descoped mid-delivery, overfunded ones waste capital that could have gone elsewhere, and misaligned stakeholders lose confidence in the team long before the code ships.
The SEI at Carnegie Mellon frames software cost estimation as a tool for deciding affordability and prioritizing scope, with size metrics and cost drivers working together to explain variation. That framing matters because it positions estimation as a decision-support discipline, not a scheduling exercise. When teams treat it that way, estimates become living artifacts that inform trade-off conversations rather than fixed commitments that haunt retrospectives.
Poor estimates also compound. For product owners, that means deferred roadmap items. For project managers, it means difficult conversations that could have been avoided with a better process up front.
When should you run estimates across the project lifecycle?
Estimation is not a one-time event. The fidelity you can reasonably achieve changes as requirements mature, and the method you use should change with it. PMI’s guidance on Agile project estimation describes this as rolling-wave planning: start with gross-level top-down estimates, then progressively elaborate as you learn more.
-
Concept / feasibility (error band: ±50–100%). Inputs are a problem statement and rough feature list. Use analogous estimation or T-shirt sizing. The output is a rough order-of-magnitude range to decide whether to fund discovery.
-
Proposal / budget (error band: ±25–50%). Inputs are a high-level scope document and any available analogues. Use parametric models or affinity grouping. The output is a budget range with explicit assumptions for the funding request.
-
Release planning (error band: ±10–25%). Inputs are a prioritized backlog with acceptance criteria. Use story points with velocity calibration or a bottom-up WBS. The output is a release forecast with a 50/90 range.
-
Sprint / iteration planning (error band: ±5–15%). Inputs are refined user stories with clear acceptance criteria. Use task-level hour estimates or story points against known velocity. The output is a sprint commitment.
-
Re-estimation triggers. Re-estimate when: scope changes exceed 15–20% of the original baseline; a technical spike reveals a fundamentally different architecture; a key dependency shifts; or actual velocity deviates from forecast by more than two consecutive sprints.
The error bands above are practical ranges, not guarantees. They reflect the reality that uncertainty shrinks as requirements stabilize, not as the calendar advances.
What are the most common software estimation methods?
No single technique works for every project. Research surveying estimation approaches consistently finds that combining multiple methods and comparing results produces better insight than relying on one alone. The table below maps each method to its inputs, expected accuracy, and best-fit context.
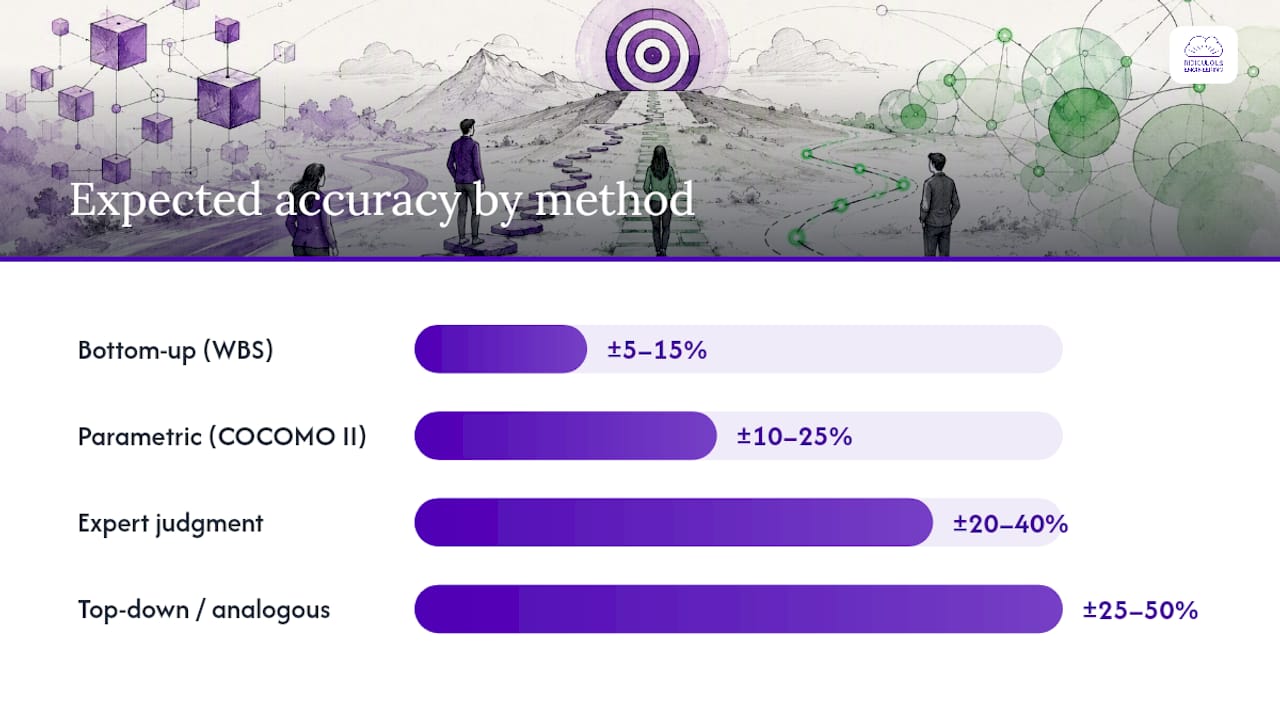
| Method | Inputs required | Expected accuracy | Best-fit project types | Data requirements |
|---|---|---|---|---|
| Top-down / analogous | Historical project data, high-level scope | ±25–50% | Early-stage, feasibility, pre-proposal | Past project records |
| Bottom-up (WBS-based) | Decomposed tasks, acceptance criteria | ±5–15% | Committed scope, fixed-price bids | Detailed requirements |
| Parametric (COCOMO II) | Size in KSLOC or function points, cost drivers | ±10–25% (calibrated) | Large programs, government procurement | Organizational calibration data |
| Expert judgment / Wideband Delphi | Domain experts, structured consensus process | ±20–40% | Novel technology, no historical data | Expert availability |
| Planning poker / story points | Relative reference items, team consensus | Relative only | Agile teams, backlog sizing | Velocity history for forecasting |
| Function points | Functional requirements, data flows | ±10–25% | Requirements-heavy, contractual work | Functional spec |
| Lines of code (LOC) | Existing codebase or language-specific norms | ±25–50% | Post-architecture review only | Code or language benchmarks |
A few notes on the methods that get misused most often:
Story points measure effort, complexity, and risk, not time. Atlassian’s estimation guidance is direct on this: converting points to hours usually signals insufficient decomposition or organizational pressure that will bias the estimate. Use points for relative sizing and velocity-based forecasting; convert to dates only after accounting for capacity and dependencies.
LOC is a weak early-stage metric because it can only be observed after code is written. GeeksforGeeks’ overview of size estimation techniques notes that LOC, function points, use-case points, and entity/process counts each have different applicability windows. LOC is most useful for post-architecture calibration, not pre-development planning.
COCOMO II produces effort in person-months using size (KSLOC or function points), scale factors, and effort multipliers across Early Design and Post-Architecture models. The COCOMO II manual is explicit: the model requires calibration to organizational data to produce accurate results. An uncalibrated COCOMO II run is a starting point, not a deliverable.
For high-stakes programs, run at least two complementary methods, such as a parametric model alongside a bottom-up WBS, and treat significant divergences as signals to investigate scope, assumptions, or data quality.
How to estimate software development time
Estimating development time comes down to a short, repeatable routine:
Break the work down. Split the project into tasks small enough to estimate in hours, not weeks. Anything larger than a few days hides unknowns.
Estimate each task in hours. Use past velocity or expert judgment per task, and write down the assumptions behind every number.
Add up, then adjust for uncertainty. Sum the task estimates and apply a buffer based on how many unknowns remain – new technology, unclear requirements, and external dependencies all push the multiplier up.
Validate against history. Compare the total with similar past projects. If it looks nothing like them, find out why before committing.
The detailed version of this routine – with sizing techniques, calibration, and uncertainty modeling – is covered in the step-by-step process below.
How do you run a step-by-step estimation process?
The sequence is: Decompose → Size → Calibrate → Aggregate → Quantify uncertainty → Validate. Each step produces an artifact. Skip a step and you lose the audit trail that makes an estimate defensible.
-
Define scope and assumptions. Write an assumption log before you size anything. Document what is in scope, what is explicitly out, which interfaces are assumed to exist, and what team composition you are assuming. This log is the single most important artifact in the process.
-
Choose your sizing metric. Story points for Agile relative sizing; function points or KSLOC for parametric models; task hours for bottom-up WBS. Match the metric to the method and the lifecycle stage.
-
Decompose the work. Build a work breakdown structure (WBS) or a feature/epic/story hierarchy. For Agile teams, this is the backlog. For waterfall or fixed-price work, it is a formal WBS. PMI’s Agile estimation guidance describes this as progressive elaboration: high-level epics first, then stories, then tasks as requirements mature.
-
Size each item. Use planning poker for story points, or task-level hour estimates for bottom-up work. Wrike’s Agile estimation guide recommends anchoring estimates in delivered reference items, which prevents the team from sizing in a vacuum. If the team debates implementation details for more than a few minutes on a single item, that item needs a spike or further decomposition, not a longer debate.
-
Apply cost drivers and calibration. Adjust raw size estimates for team experience, technology novelty, requirements volatility, and integration complexity. For parametric models, these are formal effort multipliers. For bottom-up estimates, apply a calibration factor derived from your historical velocity or past project actuals.
-
Aggregate and convert to cost. Sum effort across the WBS or backlog. Convert person-hours to dollars using your blended hourly rate (fully loaded, including benefits and overhead). Add contingency (typically 15–25% for well-defined scope, 25–40% for high-uncertainty work).
-
Quantify uncertainty and validate. Apply three-point estimation or a Monte Carlo simulation to produce a range. Cross-check against any historical analogues. If the estimate diverges significantly from analogues, investigate before presenting.
Pro Tip: Run estimation workshops in a single 60–90 minute timebox. Assign a facilitator whose job is to keep the team sizing, not debating architecture. Use three reference items at the start (one small, one medium, one large) to calibrate the team’s scale before touching the backlog. Teams that skip this calibration step routinely produce inconsistent sizes across sessions.
How do you model uncertainty in a software estimate?
Always report a range and a confidence percentile, not a single number. A single-point estimate communicates false precision and sets the team up for a conversation about why the project is “late” when it lands anywhere outside that number.
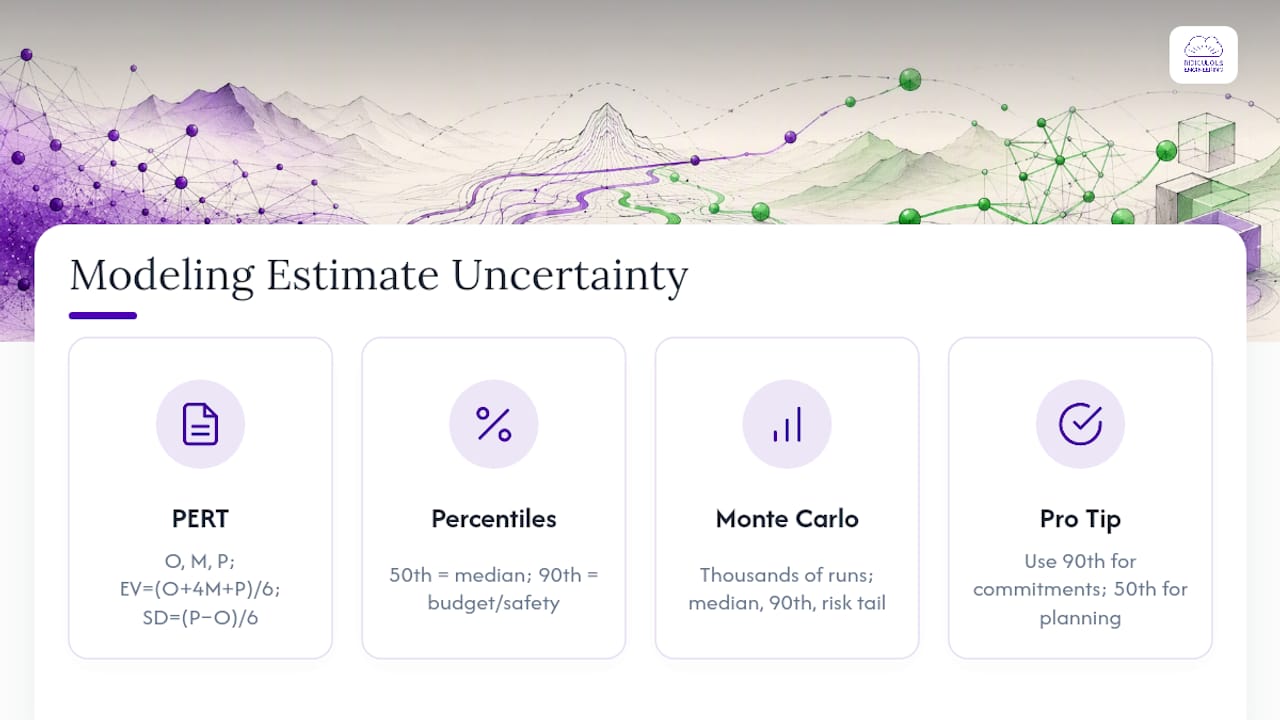
Three-point estimation (PERT) is the practical starting point. For each task or work item, capture three estimates: optimistic (O), most likely (M), and pessimistic (P). The PERT expected value is calculated as (O + 4M + P) / 6. The standard deviation is (P - O) / 6. Aggregate these across the WBS to get a distribution for the total estimate.
The 50/90 percentile framework is the most useful way to communicate that distribution to stakeholders. The 50th percentile (median) is the outcome you expect roughly half the time under current assumptions. The 90th percentile is the budget or schedule you need to be confident you will not overrun. Use the 50th percentile for internal planning and the 90th percentile for funding requests and fixed-price contracts.
Monte Carlo simulation takes this further by running thousands of iterations across the full distribution of task estimates and producing a probability curve for the total. You can run a basic Monte Carlo in a spreadsheet using random sampling from triangular distributions (O, M, P) for each task. The output tells you not just the median and 90th percentile, but the shape of the risk: a long right tail means a few tasks carry most of the schedule risk.
Statistic callout: The SEI’s software cost estimation framework explicitly requires uncertainty and risk analysis as requirements mature, because early-stage estimates carry irreducible uncertainty that no amount of planning can eliminate.
Pro Tip: Use the 90th percentile for any commitment you make to finance, executives, or clients. Use the 50th percentile for internal sprint and release planning. Presenting both in the same slide, with a clear label on each, is the fastest way to build stakeholder trust in your estimation process.
What estimation mistakes and biases should you watch for?
The biggest anti-pattern in software project estimation is treating an estimate as a promise. The moment a number becomes a commitment, the team stops updating it as they learn more, and the gap between the estimate and reality widens silently until it becomes a crisis. The fix is structural: always present estimates as ranges with explicit assumptions, and establish a re-estimation cadence from the start.
Beyond that structural failure, these are the biases and mistakes that appear most predictably:
- Anchoring. The first number mentioned in an estimation session becomes the gravitational center for all subsequent estimates. Mitigation: use blind estimation (everyone writes their number simultaneously, as in planning poker) before any number is spoken aloud.
- Optimism bias. Teams consistently underestimate duration and overestimate their own productivity. Mitigation: apply reference-class forecasting by comparing the current project to the actual outcomes of past similar projects, not to the original estimates of those projects.
- Mixing story points with hours. Story points are a relative sizing tool. Wrike’s Agile estimation guide is clear that estimation is sizing, not scheduling. Converting points to hours for anything beyond short-term capacity checks introduces false precision and erodes the team’s trust in the process.
- Estimation by proxy. Letting one person estimate on behalf of the whole team, or accepting a vendor’s estimate without independent review, removes the distributed knowledge that makes estimates accurate. Require the people doing the work to size the work.
- Scope creep without re-estimation. Adding features without adjusting the estimate is how projects double in size while the budget stays fixed. Establish a threshold (typically 15–20% scope change) that triggers a formal re-estimation.
For vendor bids and fixed-price contracts, a short mitigation checklist: require the vendor to document all assumptions in writing; ask for historical calibration data or reference projects; and commission an independent estimate for any engagement above your organization’s materiality threshold. Legacy modernization projects are particularly prone to hidden complexity that surfaces only after work begins, making independent review especially valuable.
Which tools and metrics help you estimate more reliably?
For Agile teams, standardize on two metrics first: velocity (story points delivered per sprint) and cost per point (total sprint cost divided by points delivered). Everything else builds on those two numbers. For large programs using parametric models, the priority is a calibrated COCOMO II model with at least three to five past projects in the calibration dataset.
The benchmark ranges above are reference points, not targets. Calibrate against your own team’s history before using any external benchmark.
Templates worth maintaining:
- Assumption log: a living document updated at every re-estimation event
- Historical calibration sheet: actual vs. estimated effort for past projects, organized by project type and team composition
- PERT/Monte Carlo spreadsheet: three-point inputs for each WBS item, aggregated to a total distribution
- Velocity tracker: rolling sprint-by-sprint velocity with notes on anomalies (team changes, holidays, scope spikes)
COCOMO II is worth adopting when your organization runs multiple large programs (typically above 50,000 lines of code or equivalent function points) and has the historical data to calibrate it. The calibration effort is real: expect two to four weeks of data collection and model fitting for an initial calibration, with ongoing updates as new projects complete. For smaller teams or earlier-stage work, a well-maintained velocity tracker and calibration sheet will serve you better than an uncalibrated parametric model. The Agile Advantage framework explains why relative sizing and velocity-based forecasting tend to outperform point-in-time parametric estimates for iterative delivery.
When should you estimate in-house vs. bring in a consultancy?
For scope under three sprints with a stable backlog and a team that has delivered similar work before, in-house estimation is the right call. For large, cross-team, high-risk, or legacy modernization work, an external consultancy adds value by bringing calibration data, independent review, and estimation methods the internal team may not have used before.
Before you engage a vendor or request a fixed-price bid, collect this evidence packet:
- Written acceptance criteria for every feature in scope
- Interface specifications for all external systems the software must connect to
- At least two historical analogues (past projects of similar type and size) with actual effort data
- A risk register covering technical, organizational, and dependency risks
- Results from any technical spikes run to resolve architectural unknowns
- A team composition assumption (roles, seniority, full-time vs. part-time)
- A requirements volatility assessment (how likely is scope to change, and in which areas)
Decision flow:
- You have historical velocity and a stable backlog: run a velocity-based bottom-up estimate in-house.
- You have high unknowns or novel technology: run a spike first, then re-estimate with the spike results as input.
- You are preparing a fixed-price contract or government bid: use at least two complementary methods and consider an independent review.
- You are modernizing legacy systems or integrating across multiple platforms: the hidden complexity risk is high enough that consultancy support on the estimation itself is often worth the cost.
Pro Tip: When negotiating a fixed-price engagement, share your assumption log with the vendor and ask them to confirm or correct each assumption in writing. Divergences between your assumptions and theirs are the most reliable predictor of change orders. Resolving them before signing is cheaper than resolving them during delivery.
Ridiculous Engineering’s software consulting and delivery support engagements typically begin with a scoping session that produces a shared assumption log and a 50/90 range before any fixed-price work is agreed. That process protects both sides.
Worked example: estimating a three-epic release end-to-end
This example delivers a 50/90 effort range, a person-month total, and a dollar conversion for a mid-size web application release. All numbers are illustrative; calibrate against your own team’s data.
Inputs and assumptions:
- Three epics: user authentication (Epic A, mostly reused patterns), reporting dashboard (Epic B, new build), and third-party API integration (Epic C, moderate unknowns)
- Team: two senior engineers, one mid-level engineer, one QA engineer
- Velocity: 32 story points per two-week sprint (rolling three-sprint average)
- Blended hourly rate: $150/hour (fully loaded)
- Sprint capacity: 80 person-hours per engineer per sprint
- Requirements volatility: moderate (25% multiplier applied to pessimistic estimates)
Sizing and PERT inputs:
PERT expected value per epic = (O + 4M + P) / 6. Total PERT expected value: 105 story points.
Conversion to sprints and person-months:
At 32 points per sprint, 105 points requires approximately 3.3 sprints (50th percentile). The pessimistic total of 168 points requires approximately 5.3 sprints (90th percentile, before volatility adjustment).
With a four-person team at 80 hours per person per two-week sprint, each sprint represents 320 person-hours, or approximately 1.9 person-months (at 168 hours per person-month). Total effort range: a person-months range from the 50th percentile to the 90th percentile with volatility applied.
Dollar conversion:
At a blended hourly rate, the estimated dollar cost ranges from a mid-level estimate to a higher estimate with contingency applied.
The volatility multiplier nearly doubles the upper bound, which is the point. Presenting only the most-likely estimate would have set a budget that the 90th percentile outcome would blow through without warning.
Ridiculous Engineering helps you build estimates you can defend
Ridiculous Engineering works with product teams and business leaders to produce scoped engagements grounded in explicit assumptions, calibrated effort ranges, and honest risk assessment, not optimistic single-point numbers designed to win a bid.
Our team brings the same engineering discipline to estimation that we bring to delivery: we document assumptions, run complementary methods, and present 50/90 ranges so you know what you are committing to. If you are preparing for a vendor selection, a board funding request, or a fixed-price contract, start with a scoping conversation and bring the assumption log you built using this guide.
Sources
These are the highest-value references for going deeper on specific methods:
- Agile estimation: planning poker, story points, and sizing – Atlassian
- Software cost estimation explained – SEI (CMU)
- COCOMO II manual
- Agile project estimation techniques – PMI
- Ultimate guide to Agile estimation techniques 2026 | Wrike
FAQ
How do you estimate a software development project?
Decompose the scope into a work breakdown structure or backlog, size each item using a method matched to your lifecycle stage (story points for Agile, task hours for committed scope), apply cost drivers and calibration, then aggregate and convert to a 50/90 effort range and dollar figure using your blended hourly rate.
What are the four main types of software estimation?
The four broad categories are expert judgment (Wideband Delphi, planning poker), analogous estimation (comparing to past projects), parametric estimation (COCOMO II and similar models), and bottom-up estimation (WBS-based task decomposition). Most reliable estimates combine at least two of these.
How do you estimate the cost of a software project?
Convert your effort estimate (in person-hours or person-months) to dollars using a fully loaded blended hourly rate that includes salaries, benefits, and overhead. For a full breakdown of rates and pricing models, see our guide to how much custom software development costs in 2026.
What is the 50/90 estimation technique?
The 50/90 technique reports two percentile outcomes from a probability distribution of effort or duration. The 50th percentile (median) is the outcome expected roughly half the time; the 90th percentile is the budget or schedule needed to avoid overrun with high confidence. Use the 50th for internal planning and the 90th for funding requests and fixed-price contracts.
When should story points be converted to hours?
Story points should only be converted to hours for short-term capacity checks, such as confirming a sprint fits within available team hours. Using points-to-hours conversion for multi-sprint or release-level forecasting introduces false precision and undermines the relative sizing model that makes story points useful in the first place.