Data Warehouse Migration: A Practical Guide for IT Leaders
Data Warehouse Migration: A Practical Guide for IT Leaders Use a phase-based migration with a hybrid strategy: replatform production-critical tables, redesign where technical debt blocks scale, and lift-and-shift only for rarely accessed or near-retired assets.
Use a phase-based migration with a hybrid strategy: replatform production-critical tables, redesign where technical debt blocks scale, and lift-and-shift only for rarely accessed or near-retired assets. The single most valuable thing you can do this week is assign an owner and run a focused discovery audit, cataloging your key production tables and main downstream consumers. Two risks will surface immediately if you skip that step: undocumented dependencies that break downstream reports on cutover day, and years of accumulated technical debt that you will pay to host in the cloud at a higher per-query cost than you paid on-premises.
If you would rather have an experienced team run that audit for you, Ridiculous Engineering offers structured assessment engagements designed to turn discovery data into a prioritized migration roadmap.
Table of Contents
-
What does a data warehouse migration look like phase by phase?
-
What design and modeling choices matter most on the target platform?
-
How do you move data and convert pipelines during execution?
-
Which tool categories should you evaluate for your migration?
What does a data warehouse migration look like phase by phase?
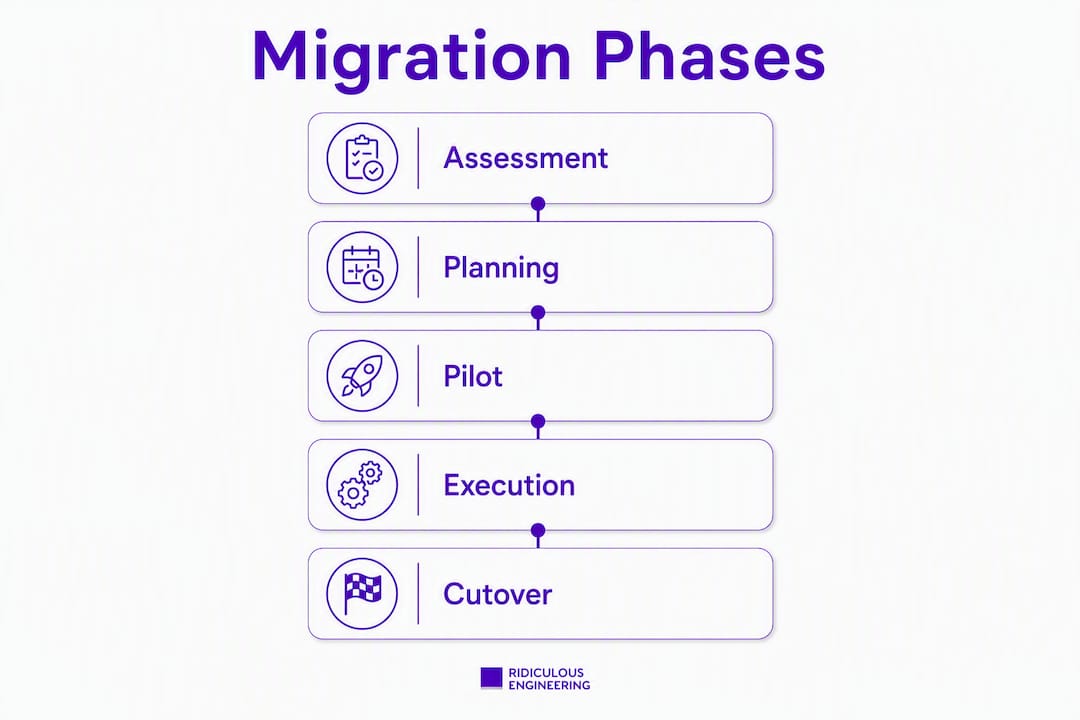
Most successful migrations use a hybrid approach rather than a single strategy, and that hybrid only works when each phase has a clear entry condition and a defined deliverable. The six phases below form the canonical framework.
-
Assessment — Deliverable: system inventory, data-flow map, dependency matrix, and risk register. Success means you know what runs in production and what does not.
-
Planning — Deliverable: migration roadmap with prioritized workstreams, team assignments, and a go/no-go scorecard per asset. Success means every stakeholder has signed off on scope.
-
Design — Deliverable: target schema designs, naming conventions, security model, and materialization strategy. Success means the target platform is designed for its own characteristics, not copied from the legacy system.
-
Execution — Deliverable: migrated data, converted ETL/ELT pipelines, and a running parallel environment. Success means source and target are reconciled and in sync.
-
Testing and cutover — Deliverable: validation report, accepted KPI comparisons, and a signed cutover plan with rollback triggers. Success means business users have signed off on data parity.
-
Post-migration optimization — Deliverable: query tuning log, cost governance baseline, observability dashboards, and operational runbooks. Success means the new platform performs better than the legacy system, not just differently.
Decision gates between phases: move from assessment to planning only when the inventory is complete and the risk register is reviewed. Move from planning to design only when scope is frozen and the migration strategy (lift-and-shift, replatform, or redesign) is assigned per asset. Move from execution to testing only when parallel environments are running and initial reconciliation passes. Move from testing to cutover only when acceptance criteria are met and a rollback plan is documented.
A focused pilot scoped to a single domain, one representative ETL pipeline, and one reporting workload is the right way to validate tooling and approach before committing to full rollout.
How do you audit your warehouse before migration begins?
Assessment is the phase most teams underinvest in, and it is the one that determines whether the rest of the project succeeds. Incomplete discovery leads directly to migrating unused assets and inflated cloud costs. Treat this phase as an opportunity to remove bloat, not replicate it.

Inventory checklist
For each table or dataset, collect:
-
Schema name, table name, and owner
-
Row count and approximate storage size
-
Partitioning and indexing strategy
-
Refresh cadence and data freshness SLA
-
Query frequency (pull from query logs, not assumptions)
-
Top-consuming queries by compute cost
-
ETL runtime and failure rate
-
Downstream reports, dashboards, and APIs that depend on this table
-
Business criticality rating from the owning team
Discovery techniques
-
Automated cataloging: tools like Apache Atlas or cloud-native catalog services can scan schemas and surface lineage automatically. Start there before any manual work.
-
Query log analysis: export query history spanning several weeks to identify which tables are actually read in production versus which ones exist only in documentation.
-
Dependency tracing: map foreign key relationships, view definitions, and stored procedure references to build a dependency graph.
-
Stakeholder interviews: BI leads, data analysts, and application owners will know about undocumented production behaviors that no catalog tool will surface.
Metrics to collect per asset
Collect row counts, query frequencies, top-consuming queries, ETL runtime, cost per query, and data freshness windows. These metrics feed directly into the scoring rubric in the assessment section later in this guide.
Pro Tip: Automate the initial inventory pull using your warehouse’s information schema views (e.g., INFORMATION_SCHEMA.TABLES, INFORMATION_SCHEMA.COLUMNS) and query history tables. Export to a spreadsheet or catalog tool, then layer in manual business-criticality ratings from stakeholder interviews. This hybrid approach cuts inventory time significantly compared to fully manual cataloging.
Deliverables from this phase: a system inventory, a data-flow map, a dependency matrix, a risk register, and a feasibility scorecard. The scorecard is what drives your lift-and-shift versus replatform versus redesign decisions.
What design and modeling choices matter most on the target platform?
The most common design mistake in a warehouse migration is copying the legacy schema to the target platform without accounting for how that platform charges for compute and storage. Platform-specific design means partitioning and clustering for serverless engines like BigQuery-style platforms, and choosing distribution keys carefully for MPP-style clouds. Legacy distribution keys rarely translate well.
Modeling patterns
-
Medallion architecture (bronze/silver/gold): raw ingestion in bronze, cleaned and conformed data in silver, business-ready aggregates in gold. This pattern works well for cloud lakehouses and makes lineage transparent.
-
Dimensional vs. raw layers: keep a raw layer for auditability and build conformed dimensions on top. Avoid collapsing these into a single layer during migration.
-
Denormalization choices: cloud warehouses with columnar storage often benefit from wider, denormalized tables. Evaluate join frequency and query patterns before deciding.
-
Column types and nested fields: use native array and struct types where the platform supports them to reduce join overhead, but only when downstream consumers can handle the structure.
Materialization strategy
-
Use views for lightweight transformations that run infrequently or where freshness is critical.
-
Use materialized views for aggregations queried repeatedly on large datasets.
-
Use aggregated tables (precomputed) for dashboards with strict latency SLAs.
-
Compute-on-read is cheaper for low-frequency queries; precompute for high-frequency ones.
Security and governance checklist
-
Define role-based access control at the schema and table level before migration, not after.
-
Classify data by sensitivity (PII, PHI, confidential, public) and apply column-level masking where required.
-
Encrypt data at rest and in transit; confirm the target platform’s default encryption settings.
-
Establish data lineage tracking from ingestion through transformation to reporting.
-
Document schema evolution strategy: additive changes only (new columns, new tables) are backward-compatible; column renames and type changes are not.
Naming conventions matter more than teams expect. Agree on a standard (snake_case, prefix by layer, suffix by materialization type) before execution begins, and enforce it in code review.
How do you move data and convert pipelines during execution?
Execution is where plans meet reality. The goal is to move data reliably, convert ETL/ELT logic accurately, and keep source and target synchronized long enough to validate parity before cutover.
Data movement patterns
-
Full historical load: extract the entire dataset once. Use this for static or rarely updated tables. Simple, but it creates a point-in-time snapshot that drifts immediately if the source is active.
-
Incremental sync: extract only records changed since the last run using a watermark column (e.g.,
updated_at). Faster than full loads but requires a reliable change indicator on the source. -
Change data capture (CDC): CDC enables near-real-time replication by reading the source system’s transaction log. It minimizes cutover windows compared with bulk-only methods and is the right choice for active transactional sources.
Code migration
Automated SQL translators handle dialect differences (e.g., Teradata SQL to BigQuery SQL, Oracle to Snowflake) faster and more consistently than manual rewrites for standard DML. However, stored procedures with complex control flow, vendor-specific functions, and dynamic SQL usually require manual refactoring. Budget time for those explicitly; they are where projects slip.
Automation handles schema drift and repetitive translation tasks more reliably than hand-written scripts, which improves cutover reliability. Use mature connectors and translators for the repeatable work, and reserve engineering time for the logic that genuinely requires human judgment.
Orchestration and parallel runs
-
Build idempotent pipelines: every run should produce the same result regardless of how many times it executes. This makes retries safe.
-
Implement retry semantics with exponential backoff for transient failures.
-
Run source and target pipelines in parallel during execution so reconciliation can happen continuously, not just at cutover.
-
Monitor pipeline telemetry (row counts, latency, error rates) from day one of execution, not just during the validation window.
Connecting legacy sources to modern destinations requires careful planning around connector compatibility, especially when source systems are on-premises and targets are cloud-native.

How do you validate data and plan a safe cutover?
Validation is where teams discover that row-count matching is necessary but nowhere near sufficient. Row counts catch only the most obvious problems; parallel runs and business user validation are what surface logic and semantic errors.
Validation steps
-
Structural checks: confirm all tables, columns, data types, and constraints exist on the target.
-
Row-count reconciliation: match row counts per table between source and target.
-
Checksum and hash comparisons: compute checksums on key columns to detect silent data corruption.
-
Aggregate comparisons: compare SUM, COUNT, AVG, MIN, MAX for critical metrics across matching time windows.
-
KPI reconciliation: run the same business reports against both systems and compare outputs.
-
Sample record verification: spot-check individual records across multiple tables, especially for tables with complex transformations.
-
Query performance benchmarks: run the top 20 production queries on the target and compare execution times against the source baseline.
Acceptance criteria
Define these before execution begins, not during the validation window:
-
Data parity threshold (e.g., aggregate values within 0.01% of source)
-
Query performance SLA (e.g., P95 query time within 20% of source baseline)
-
Zero critical KPI discrepancies
-
Business user sign-off from at least one owner per domain
Cutover options
| Strategy | Description | Rollback complexity | Typical use case |
|---|---|---|---|
| Parallel run | Both systems live; traffic gradually shifts | Low — revert traffic to source | Most migrations; recommended default |
| Blue/green | Full cutover at a scheduled time; source kept warm | Medium — switch DNS/connections back | Well-tested, lower-risk environments |
| Phased by domain | Cut over one business domain at a time | Low per domain | Large enterprise EDW with independent domains |
| Big-bang | Single cutover event; source decommissioned immediately | High — no fallback | Small datasets; rarely recommended |
Reserve a multi-day window for final parallel-run reconciliation and sanity checks before decommissioning the legacy system. Teams consistently underestimate this window, and the cost of extending it is far lower than the cost of rolling back a premature decommission.
Cutover communication plan: assign a named owner for each step, document rollback triggers (e.g., KPI discrepancy above threshold, pipeline failure rate above X%), and distribute the plan to all stakeholders at least 48 hours before the cutover window opens.
What happens after cutover, and why does it matter?
Post-migration optimization is a planned phase, not an afterthought. A migrated warehouse that has not been tuned for its new environment is often slower and more expensive than the legacy system it replaced, which is a hard conversation to have with leadership.
Tuning and maintenance tasks
-
Run query profiling on high-impact production queries and identify full-table scans, missing clustering keys, and inefficient join patterns.
-
Tune partitioning and clustering based on actual query patterns observed post-migration, not pre-migration assumptions.
-
Run vacuum and compaction jobs on tables with high update or delete rates.
-
Clean up migrated objects that were flagged as low-priority during assessment but carried over anyway.
Cost governance
Without redesign, legacy query patterns and unnecessary joins inflate compute costs in cloud warehouses where compute is charged per query. Key controls:
-
Set storage lifecycle policies to move cold data to cheaper tiers automatically.
-
Implement query result caching where the platform supports it.
-
Monitor egress costs if your analytics consumers are in a different cloud region or provider.
-
Set budget alerts at 80% and 100% of monthly compute budget.
Observability
-
Instrument pipelines with row-count, latency, and error-rate metrics from day one.
-
Define SLIs and SLOs for data freshness (e.g., “silver layer refreshed within 30 minutes of source commit”) and query latency.
-
Set up anomaly detection on key metrics so silent failures surface before business users notice them.
For teams scaling into cloud-native architectures, post-migration tuning is also the right moment to evaluate whether the current data model supports the AI/ML workloads the business wants to run next.
Which tool categories should you evaluate for your migration?
Choosing tooling before you understand your migration’s specific requirements is one of the more expensive mistakes a team can make. Evaluate by capability and fit, not by brand recognition.
Tool categories to assess
-
Connectors and CDC platforms: look for native support for your source system, schema drift handling, and idempotent ingestion. Confirm the connector supports your required replication mode (full, incremental, CDC).
-
ETL/ELT and transformation frameworks: evaluate automated SQL translation coverage for your source dialect, support for dbt-style modular transformations, and the ability to handle stored procedure migration.
-
Orchestration platforms: assess retry semantics, dependency management, alerting, and integration with your existing CI/CD tooling.
-
Cataloging and lineage tools: confirm they can scan your source and target schemas automatically and surface column-level lineage.
-
Testing and validation tools: look for built-in aggregate comparison, row-count reconciliation, and the ability to define custom acceptance criteria.
Feature checklist for any tool under evaluation
-
Schema drift detection and automated handling
-
Automated SQL translation with coverage reporting
-
Idempotent ingestion (safe retries)
-
Rollback or rewind support
-
Monitoring and alerting out of the box
-
Cloud-native integration with your target platform
Pilot guidance
Scope your pilot to one business domain, one representative ETL pipeline, and one reporting workload. Define exit criteria before the pilot starts: minimum throughput, maximum error rate, and successful KPI reconciliation. A pilot that lacks exit criteria is just a proof of concept that never ends.
Smart cost management practices during the pilot phase, including monitoring storage and compute consumption from the first day, prevent cost surprises from compounding into the full migration.
What are the most common mistakes teams make?
Most migration failures are predictable. The patterns repeat across projects of every size.
Preventive checklist
-
Freeze scope after the planning phase. Changes to migration scope during execution are the single largest source of timeline overruns.
-
Audit all downstream dependencies before execution begins, not during the validation window.
-
Schedule parallel runs for every production domain, not just the ones you are most confident about.
-
Plan a minimum 48-hour validation window after cutover before decommissioning the legacy system.
-
Assign a named owner for every table in the inventory. Unowned assets become blockers.
-
Document rollback triggers and test the rollback procedure before the cutover window opens.
Common pitfalls and mitigations
-
Migrating technical debt: teams replicate legacy schemas without evaluating whether the underlying models still serve the business. Mitigation: use the assessment scoring rubric to flag high-debt assets for redesign rather than lift-and-shift.
-
Underestimating cutover validation time: the 48-hour minimum is a floor, not a target. Complex environments with many downstream consumers need longer. Mitigation: add a validation buffer to the project plan during planning, not during execution.
-
Missing downstream dependencies: a table that appears unused in query logs may be read by a monthly batch job that last ran six weeks ago. Mitigation: extend query log analysis to at least 90 days and conduct stakeholder interviews.
-
Ignoring cost governance: teams focus on data parity and ignore compute costs until the first cloud bill arrives. Mitigation: set budget alerts and review cost dashboards weekly from the first day of execution.
-
Skipping change management: end users who are not informed about cutover timelines and training plans will route around the new system or escalate data quality concerns that are actually familiarity issues. Mitigation: include a stakeholder communication plan in the project plan from day one.
How long does a migration take, and what does it cost?
Timeline and budget vary more than most guides admit. The honest answer depends on data volume, transformation complexity, downstream dependencies, and how much technical debt you are choosing to address rather than carry forward.
Sample timelines
-
Small migration (single domain, limited pipelines): Small migrations can complete in 4–6 weeks. Typical for a single business unit moving a well-documented dataset with few downstream consumers.
-
Medium migration (multiple domains, moderate complexity): Medium-complexity projects typically run 12–24 weeks. Typical for a mid-size organization consolidating several source systems into a cloud data warehouse.
-
Enterprise EDW modernization: Enterprise modernizations can range from 8–50 weeks depending on data volume, integration complexity, and downstream dependencies. Plan for contingency in complex environments.
Team roles you must staff
-
Project owner: accountable for scope, timeline, and stakeholder communication
-
Data engineering lead: owns pipeline conversion, CDC implementation, and execution
-
Platform/infrastructure lead: owns target platform configuration, security, and cost governance
-
QA/validation lead: owns acceptance criteria, validation scripts, and cutover sign-off
-
BI/product owner: represents downstream consumers and signs off on KPI reconciliation
-
Change manager: owns training, documentation, and end-user communication
Cost drivers
-
Data volume and history depth (more data = more compute for initial load and validation)
-
Transformation complexity (stored procedures and vendor-specific functions require manual effort)
-
Required downtime tolerance (lower tolerance = more parallel-run infrastructure cost)
-
Tooling licenses (connectors, orchestration platforms, cataloging tools)
-
Engineering effort (internal team hours plus any external consulting)
-
Post-migration support (tuning, runbook maintenance, and ongoing cost governance)
Budget a contingency of 30–50% on complex migrations. The contingency is not pessimism; it is the cost of the unknowns that the assessment phase has not yet surfaced. Teams that skip the contingency buffer are the ones that request emergency scope changes in week eight.
Aligning migration priorities with business goals rather than purely technical criteria is what separates migrations that deliver measurable ROI from ones that just move the problem to a more expensive environment.
Ridiculous Engineering’s assessment scoring rubric
This rubric converts discovery data into a prioritized decision list. Score each asset on five dimensions, sum the scores, and apply the action rules below.
Scoring dimensions (1–5 scale each)
| Dimension | 1 (Low) | 3 (Medium) | 5 (High) |
|---|---|---|---|
| Business criticality | Rarely used, no SLA | Used weekly, informal SLA | Daily use, formal SLA, revenue-linked |
| Query frequency | < 1 query/day | 1–50 queries/day | > 50 queries/day |
| Technical debt | Clean, documented | Some undocumented logic | Heavy stored procedures, no docs |
| Data quality | Known issues, low trust | Occasional anomalies | High trust, validated regularly |
| Downstream dependencies | 0–1 consumers | 2–5 consumers | 6+ consumers |
Sample inventory with priority scores
| Asset | Criticality | Query Freq | Tech Debt | Data Quality | Dependencies | Total |
|---|---|---|---|---|---|---|
orders_fact |
5 | 5 | 3 | 4 | 5 | — |
legacy_staging_v2 |
1 | 1 | 5 | 2 | 1 | — |
customer_dim |
4 | 4 | 2 | 5 | 4 | — |
archive_raw |
1 | 1 | 1 | 3 | 1 | 7 |
marketing_agg |
3 | 3 | 4 | 3 | 3 | — |
Action rules
-
Score 18–25: Replatform with redesign. These assets are business-critical and carry enough technical debt or downstream complexity that a lift-and-shift will create ongoing problems.
-
Score 12–17: Replatform with targeted optimization. Move to the target platform and address the highest-debt elements, but a full redesign is not required.
-
Score 7–11: Lift-and-shift or archive. Low criticality and low query frequency make these candidates for a direct move or decommission.
-
Score below 7: Archive or decommission. Validate with the owning team, then remove from scope.
Checklist mapped to rubric outcomes
-
[ ] Assign a score to every asset in the inventory before planning begins
-
[ ] Flag all assets scoring 18+ for redesign review with the data engineering lead
-
[ ] Confirm decommission candidates with business owners before removing from scope
-
[ ] Document the scoring rationale for each asset in the risk register
-
[ ] Review scores after stakeholder interviews, as business criticality often changes
Pro Tip: Populate initial scores for query frequency and technical debt automatically by querying your warehouse’s information schema and query history tables. Use a simple SQL script to count queries per table over the last 90 days and flag tables with stored procedure dependencies. Manual scoring for business criticality and data quality takes an hour per stakeholder interview; automate everything else.
Key Takeaways
A phase-based data warehouse migration with a hybrid strategy (replatform for critical assets, redesign where technical debt blocks scale, lift-and-shift for low-priority assets) consistently outperforms single-strategy approaches in cost, reliability, and time to value.
| Point | Details |
|---|---|
| Assessment drives every decision | Incomplete discovery leads to migrating unused assets and inflated cloud costs; catalog production tables before planning begins. |
| Hybrid strategy beats single-mode | Assign lift-and-shift, replatform, or redesign per asset using a scored rubric, not a blanket rule. |
| Validation takes longer than planned | Reserve a sufficient parallel-run window after cutover before decommissioning the legacy system. |
| Post-migration is a planned phase | Budget for query tuning, cost governance, and observability from the start; these are not optional cleanup tasks. |
| Ridiculous Engineering as your partner | Ridiculous Engineering provides assessment engagements, replatforming projects, and post-migration optimization for teams that need experienced outside support. |
How Ridiculous Engineering supports your migration
Data warehouse migrations are one of the more consequential infrastructure decisions an organization makes, and the gap between a well-executed migration and a poorly scoped one shows up directly in cloud costs, analyst productivity, and the reliability of every downstream report. Ridiculous Engineering’s custom software and data engineering services are built for exactly this kind of high-stakes, complex project.
The team at Ridiculous Engineering runs structured assessment engagements that produce the inventory, dependency matrix, and scoring rubric described in this guide, so you start execution with a clear, prioritized roadmap rather than a list of assumptions. From there, the team handles replatforming and refactor projects, CDC and orchestration implementation, and post-migration tuning and cost governance. For organizations that need ongoing support after cutover, Ridiculous Engineering offers retained engineering and fractional technical leadership.
If you are at the beginning of a migration and need a clear picture of scope, risk, and timeline before committing to a full project plan, the right next step is a focused discovery engagement. Contact Ridiculous Engineering to discuss an assessment scoped to your environment.
Useful sources and further reading
The following sources informed this guide and are worth reviewing directly for deeper technical detail:
-
Data warehouse migration guide and best practices (ER/Studio) — Covers hybrid migration strategies, platform-specific design trade-offs, and validation approaches. Useful for the assessment and design phases.
-
How to use data modeling when migrating to the cloud (ER/Studio) — Explains why assessment uncovers undocumented production behaviors and how to use data modeling as a migration tool rather than just a documentation exercise.
-
Database migration tools and automation guidance (Fivetran) — Practical guidance on automation capabilities, schema drift handling, and where manual work is unavoidable.
-
Data migration best practices and timelines (Fivetran) — Covers cutover validation windows, pilot scoping, and timeline planning. The 48-hour minimum validation window guidance comes from this source.
-
Data Warehouse Migration: Complete Strategy and Project Plan (Exasol) — Detailed project plan guidance with timeline ranges for small through enterprise migrations.
-
Your guide on data warehouse migration (Atlan) — Strong coverage of CDC patterns and how they reduce cutover windows for active transactional sources.
Data Engineering
Planning a data warehouse migration?
From assessment and inventory to cutover and cost governance – we run the full migration so your team does not have to learn it the hard way.
FAQ
What is data warehouse migration?
Data warehouse migration is the process of moving data, schemas, pipelines, and reporting workloads from a legacy or on-premises warehouse to a new platform, typically a cloud data warehouse. It includes assessment, design, data movement, ETL conversion, validation, and post-migration optimization.
What are the four types of data migration?
The four common types are storage migration (moving data between storage systems), database migration (moving between database engines), application migration (moving data as part of an application change), and business process migration (restructuring data to support new workflows). A warehouse migration typically combines database and application migration.
Is ETL the same as data migration?
ETL (extract, transform, load) is a technique used within a data migration, not a synonym for it. Migration is the broader project; ETL or ELT is the mechanism for moving and transforming data as part of that project.
Which tool categories work best for data migration?
No single tool handles every requirement. Most teams use a combination of a CDC or connector platform for data movement, a transformation framework (such as dbt) for SQL conversion, an orchestration platform for pipeline management, and a cataloging tool for lineage. Evaluate each category against your specific source and target systems before selecting.
How long does a data warehouse migration typically take?
Small migrations can complete in 4–6 weeks; medium-complexity projects typically run 12–24 weeks; enterprise EDW modernizations can range from 8–50 weeks depending on data volume, integration complexity, and downstream dependencies.
Recommended
-
Transformative Growth with Cloud Computing | Ridiculous Engineering
-
Spanning the Data Sharing Gap: A Pathway to Mission Success | Ridiculous Engineering
-
Real-Time Data: A Game Changer for Businesses | Ridiculous Engineering
-
How to Walk the Talk: Treating Insurer Data as a Strategic Asset | Ridiculous Engineering