Best Business Intelligence Tools: A Build Guide for Leaders
Best Business Intelligence Tools: A Build Guide for Leaders If your team needs embedded analytics, proprietary metrics, or sub-second query performance on data nobody else has, the best business intelligence tools you can get are the ones built for your business, not licensed...
If your team needs embedded analytics, proprietary metrics, or sub-second query performance on data nobody else has, the best business intelligence tools you can get are the ones built for your business, not licensed from a vendor catalog. If you need standard dashboards fast and your team is small, buy something off the shelf and move on. The decision is not either/or. It’s a portfolio call. Most organizations end up with a mix.
Here’s how to tell which bucket you’re in:
- Build when analytics is part of your competitive moat: proprietary models, embedded customer-facing dashboards, or data types no vendor schema was designed for.
- Buy when you need conventional reporting fast, your team is under ten people, or the timeline is measured in weeks, not quarters.
- Hybrid when you want to buy the front-end reporting layer but build the semantic layer and data warehouse underneath it, keeping architectural control where it matters most.
The next step, regardless of which bucket you land in, is the same: run a scoped, paid pilot on your own data before committing to a full build. Sixty to ninety days, one auditable metric, no PowerPoint theater.
Pro Tip: Before you sign anything, ask a candidate consultancy to run a two-week spike on a real dataset from your warehouse, not a demo dataset. If they can’t get you a working query against your actual schema in two weeks, imagine how the next six months will go.
Key Takeaways
Custom BI platforms pay off when analytics differentiates your business, and the fastest way to validate that bet is a scoped, paid pilot before committing to a full build.
| Point | Details |
|---|---|
| Build vs. buy is a portfolio call | Buy commodity reporting, build the layers that differentiate you, and mix both where it makes sense. |
| Set a 36+ month ROI horizon | Custom builds cost more upfront but compound in value through efficiency and owned IP over time. |
| Budget by phase | Discovery runs $10k to $40k, pilots $50k to $300k, and phase 1 builds $200k to $1.2M. |
| Demand proof, not slides | Ask for architecture diagrams, semantic-layer examples, and a written exit and knowledge-transfer plan. |
| Ridiculousengineering fits the build path | Offers scoped pilots, phase 1 builds, and managed retainers with architecture, data engineering, and UX in-house. |
Table of Contents
- When Should You Build Instead of Buy Business Intelligence Software?
- What Does a Custom BI Platform Actually Involve?
- How Long Does a Custom BI Rollout Take?
- What KPIs Prove a BI Investment Is Working?
- How Do You Choose the Right BI Consultancy?
- What Should You Ask For as Proof of Delivery?
- How Do You Start a Custom BI Project?
- How Ridiculous Engineering Approaches Custom BI Builds
- Sources
- FAQ
When Should You Build Instead of Buy Business Intelligence Software?
Build usually wins when analytics sits inside your competitive moat. Buying is often the right call when analytics matters to the business but isn’t what differentiates you from competitors, according to guidance on framing build versus buy as a portfolio decision. That framing matters more than it sounds. Most leaders treat this as a single binary choice for “our BI stack.” It isn’t. It’s a dozen smaller choices about which layers of the stack create value you can defend.
Custom analytics becomes the obvious answer in a handful of recurring situations. Off-the-shelf platforms tend to break down when you need embedded, white-labeled analytics inside your own product, when your metrics are domain-specific enough that no vendor’s semantic model captures them, or when query volume and latency requirements exceed what a general-purpose tool handles gracefully.
Signals that point toward buying instead:
- You need conventional dashboards and reports, not embedded or white-label analytics.
- Your team has fewer than ten people and no dedicated data engineering headcount.
- You need something live in weeks, and the metrics you’re tracking are industry-standard.
Signals that point toward building:
- You’re serving multiple tenants with isolated data and need per-tenant customization at scale.
- Your data types (sensor streams, genomic data, proprietary scoring models) don’t map cleanly to a vendor’s schema.
- You plan to resell analytics as part of your product, which changes the licensing math entirely.
Building a custom platform is a strategic bet: higher upfront cost, but the payoff usually plays out over 36 or more months as operational efficiency compounds and you accumulate intellectual property a competitor can’t just license. That’s a real timeline, and it should shape how you set expectations with your board or your CFO before you start.
Pro Tip: A hybrid approach often wins. Buy the reporting front end (the part everyone stares at in meetings), and build the warehouse and semantic layer underneath it. You get faster time-to-value while keeping the layer that actually differentiates your analytics under your own control. Fold vendor total cost of ownership into a three-year model before comparing it to a build estimate. A cheap monthly license looks very different once you add seat growth, connector fees, and the engineering hours spent working around its limitations.
What Does a Custom BI Platform Actually Involve?
A custom BI platform breaks into five layers: ingestion, transformation and the semantic layer, storage, the serving and query layer, and the visualization or embedded UX on top. Each layer has its own failure modes, and most budget overruns trace back to underestimating one of them.
Data engineering is where the real risk concentrates. You need data contracts that define what upstream systems promise to deliver, a clear ETL or ELT strategy, metadata and lineage tracking so people can trust what they’re looking at, and governance that doesn’t collapse the moment a new data source shows up. Skipping any of these tends to surface later as a “why do these two dashboards disagree” support ticket that nobody wants to own.
Cloud architecture decisions shape your ongoing cost structure more than almost anything else. Compute for transformation jobs, storage tiering between warehouse and lakehouse, and egress fees for moving data between regions or providers all compound over time. None of that shows up in a demo. It shows up in your first quarterly cloud bill.
Operationally, you’re managing model serving, multi-tenant isolation if you’re building for multiple customer segments, query optimization so dashboards don’t time out during month-end reporting, caching strategy, and monitoring that catches pipeline failures before your VP of Sales notices the numbers are stale.
| Component | Typical Owner | Primary Concern |
|---|---|---|
| Ingestion and pipelines | Data engineer | Reliability, schema drift, data contracts |
| Storage (warehouse/lakehouse) | Platform engineer | Cost, scalability, query performance |
| Semantic layer and metrics | Data engineer / analyst | Metric consistency, governance |
| Query and serving layer | Platform engineer | Latency, caching, multi-tenant isolation |
| Visualization and UX | UX designer / product manager | Adoption, clarity, embedded experience |
Pro Tip: Ask any consultancy pitching you a build to show a real semantic-layer design from a past project, not a slide deck. The semantic layer is where metric definitions live, and if it’s an afterthought, every downstream dashboard inherits the ambiguity.
How Long Does a Custom BI Rollout Take?
A realistic delivery roadmap runs through six phases: discovery and requirements, architecture and design, a pilot or proof-of-value, phased build, rollout with change management, and ongoing operated support. This sequence isn’t a project management formality. It’s how you contain risk on a project where the failure modes (unclear metric ownership, missed performance testing, weak adoption planning) tend to surface late and expensively, per research on BI implementation frameworks.
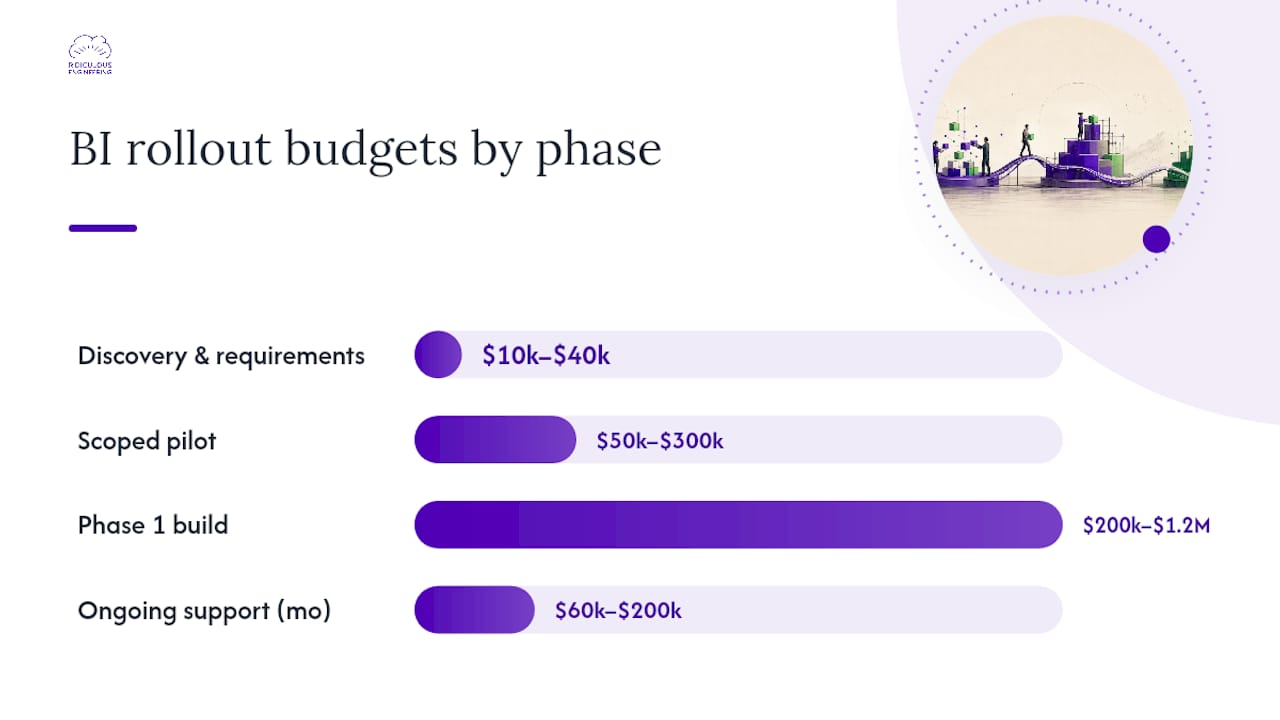
Here’s roughly how the phases and budgets tend to shake out, based on benchmarks from consultancy evaluation guides:
- Discovery and requirements: typically $10,000 to $40,000, two to four weeks. This is where you align the technical scope with actual business goals, not just a wish list of dashboards.
- Scoped pilot: $50,000 to $300,000, running 60 to 120 days with one auditable success metric everyone agrees on before starting.
- Phase 1 build: $200,000 to $1.2 million depending on scope, covering the core pipeline, warehouse, and first production dashboards.
- Ongoing managed support: $60,000 to $200,000 per month for a team of 10 to 25, if you’re keeping delivery embedded rather than transitioning fully in-house.
Requirements shift once real users start touching real dashboards, and that’s normal, not a sign the project is off the rails.
It’s worth being honest about the tradeoff here. Buying an embedded analytics platform can put first dashboards in front of users in one to four weeks, while building tenant-scoped, AI-assisted analytics features safely often takes four to eight months or more of engineering effort. That gap is exactly why the pilot matters: it lets you validate the build thesis before you’ve committed phase 1 dollars to it. Deployment itself should follow the same caution, with performance testing against production-scale data volumes, not sample sets, before anything reaches a broad user base.
What KPIs Prove a BI Investment Is Working?
Time-to-insight is the metric that matters most early, because it’s the clearest signal of whether people are actually using what you built. Track how long it takes a business user to go from question to answer, query latency under real load, the share of active users adopting the platform weekly, the percentage of decisions that cite BI output as their basis, and cost per query or cost per insight as usage scales.

Those operational KPIs only matter if you tie them to outcomes the business cares about: revenue lift from faster decisions, cost reduction from retiring manual reporting processes, cycle-time savings on things like month-end close, and compliance risk avoided through better audit trails.
The measurement approach itself is simple to describe and easy to skip: establish a baseline before you build anything, set explicit targets, instrument the platform to capture the data automatically, and report on a fixed cadence, monthly at minimum.
| KPI | Measurement Method | Owner |
|---|---|---|
| Time-to-insight | Time-stamped query logs from question to answer | Data/analytics team |
| Active-user adoption | Weekly active users against total licensed seats | Product manager |
| Decisions backed by BI | Survey or tagged decision logs referencing dashboards | Business stakeholder |
| Cost per query/insight | Total platform cost divided by query volume | Finance / platform engineer |
Total cost of ownership calculations should extend three to five years and include direct licensing or build spend, internal labor, implementation services, infrastructure, migration costs, and a realistic allowance for change orders, according to technical and financial guidance on analytics platforms. A tool that looks cheap in year one can flip that ranking entirely by year three once query volume and headcount grow. For a deeper look at connecting analytics outcomes to broader strategy, this piece on aligning data analytics with business development is worth a read.
How Do You Choose the Right BI Consultancy?
Evaluate a consultancy on delivery methodology, evidence of comparable work in your vertical, who owns the intellectual property at the end of the engagement, team composition, and security posture, including certifications like SOC 2 or ISO where relevant to your compliance requirements.
Ask these questions in your RFP or first interview, and pay close attention to how directly they’re answered:
- Show us a pilot scope built against our actual data, not a generic demo.
- What exactly will you hand over if we part ways after phase 1?
- How do you price change orders, and what triggers one?
- Walk us through an example semantic-layer design from a past engagement.
Score candidates on a weighted scorecard across time-to-market, total cost of ownership, customization depth, governance maturity, vendor lock-in risk, and team fit. Vague answers on IP ownership or exit terms are the biggest red flag in this process, more than pricing, more than the sales deck. Procurement guidance on evaluating data consultancies recommends demanding written terms on IP ownership, security certifications, and a documented knowledge-transfer plan before signing anything.
Pro Tip: Insist on a paid, scoped pilot with one auditable metric, and get the exit and knowledge-transfer plan in writing before the pilot starts, not after. If a consultancy resists putting either in writing, that tells you something about how the rest of the engagement will go.
What Should You Ask For as Proof of Delivery?
Credible delivery leaves a paper trail. Look for case studies that include a real baseline, a measured outcome, and named deliverables, not just a logo and a vague success story. Ask for architecture diagrams, a sample semantic-model design, performance test reports run against production-scale data, security certifications, and runbooks that show how the system gets handed off and supported after launch.
Team composition tells you a lot before you even get to a case study. You want solution architecture, data engineering, platform engineering, product management, UX design, and SRE or DevOps coverage represented, not a team of generalists stretched across every role at once.
A credible case study names the baseline metric before the project started, states the measured change after delivery, and lists what was actually handed over, architecture docs, source code, runbooks, not just a dashboard screenshot. If a case study can’t answer “compared to what, and handed off how,” it’s marketing, not evidence.
Verify the numbers a consultancy cites. Ask how the baseline was measured, over what time period, and whether the improvement accounts for other changes happening in the business at the same time. A number without that context is not evidence, it’s a headline.
How Do You Start a Custom BI Project?
Before your first call with a consultancy, put together a short intake package: your primary business outcomes, the critical metrics you’re tracking today, a sample dataset you can legally share, your security and compliance requirements, and the user personas and service-level expectations for whoever will actually use the platform daily.
Run the engagement in this order:
- Quick discovery to align scope with business goals.
- A paid pilot with one auditable success metric.
- Score the pilot against that metric before committing further.
- Design the scaled architecture based on what the pilot proved.
- Move into operated support once the platform is live.
Pro Tip: Negotiate an onboarding or ramp discount for the first 90 days, and get an exit-assistance clause written into the contract from the start. It’s much easier to negotiate exit terms before you sign than after you’ve realized you need them.
How Ridiculous Engineering Approaches Custom BI Builds
Ridiculousengineering brings solution architecture, data engineering, UX design, and product leadership to bespoke data analytics and business intelligence platforms, the exact mix of skills the sections above say you should be screening for. We offer three engagement shapes: a scoped paid pilot to validate the build thesis on your own data, a phase 1 build once that pilot proves out, and managed analytics retainers for teams that want ongoing operated support without hiring a full internal platform team.
In the first 30 to 90 days of an engagement, expect a discovery session tied to your actual business goals, a pilot scope built against real data from your systems, and a written plan for what gets handed over at each milestone. No vague roadmap slides. If real-time latency or self-service adoption are part of your requirements, our writing on real-time data architectures and self-service analytics governance covers the tradeoffs in more depth. If you’re ready to scope a pilot, get in touch through our custom software development page and we’ll start with a straightforward conversation about your data, not a sales pitch.
Sources
- Build vs Buy for Analytics Platforms: a technical and financial guide
- How to evaluate data analytics consulting companies
- Custom business intelligence solutions: when off-the-shelf doesn’t cut it
- Embedded analytics: build vs buy (engineering cost and timelines)
FAQ
Is It Cheaper to Buy BI Software or Build Custom?
Buying is cheaper upfront and faster to deploy, often live in one to four weeks, but building tends to pay off over a 36-plus month horizon when analytics is core to your competitive advantage.
How Long Does a Custom BI Platform Take to Build?
A scoped pilot runs between two to four months, and a full phase 1 build typically takes several additional months after that, depending on data complexity and the number of embedded features required.
What Should a BI Pilot Cost?
Scoped pilots generally have a significant cost that may range into the hundreds of thousands, while initial discovery work typically incurs a lower, but still substantial, cost before the pilot even starts.
Can Ridiculous Engineering Run a Paid Pilot on Our Data?
Yes. Ridiculousengineering structures engagements around a scoped, paid pilot with an auditable metric before scaling into a full build or managed retainer.
What’s the Biggest Risk in a Custom BI Project?
Unclear ownership of data quality and metric definitions, combined with skipping performance testing on production-scale data, is the most common cause of BI project failure.